The one chart that explains everything about our current moment
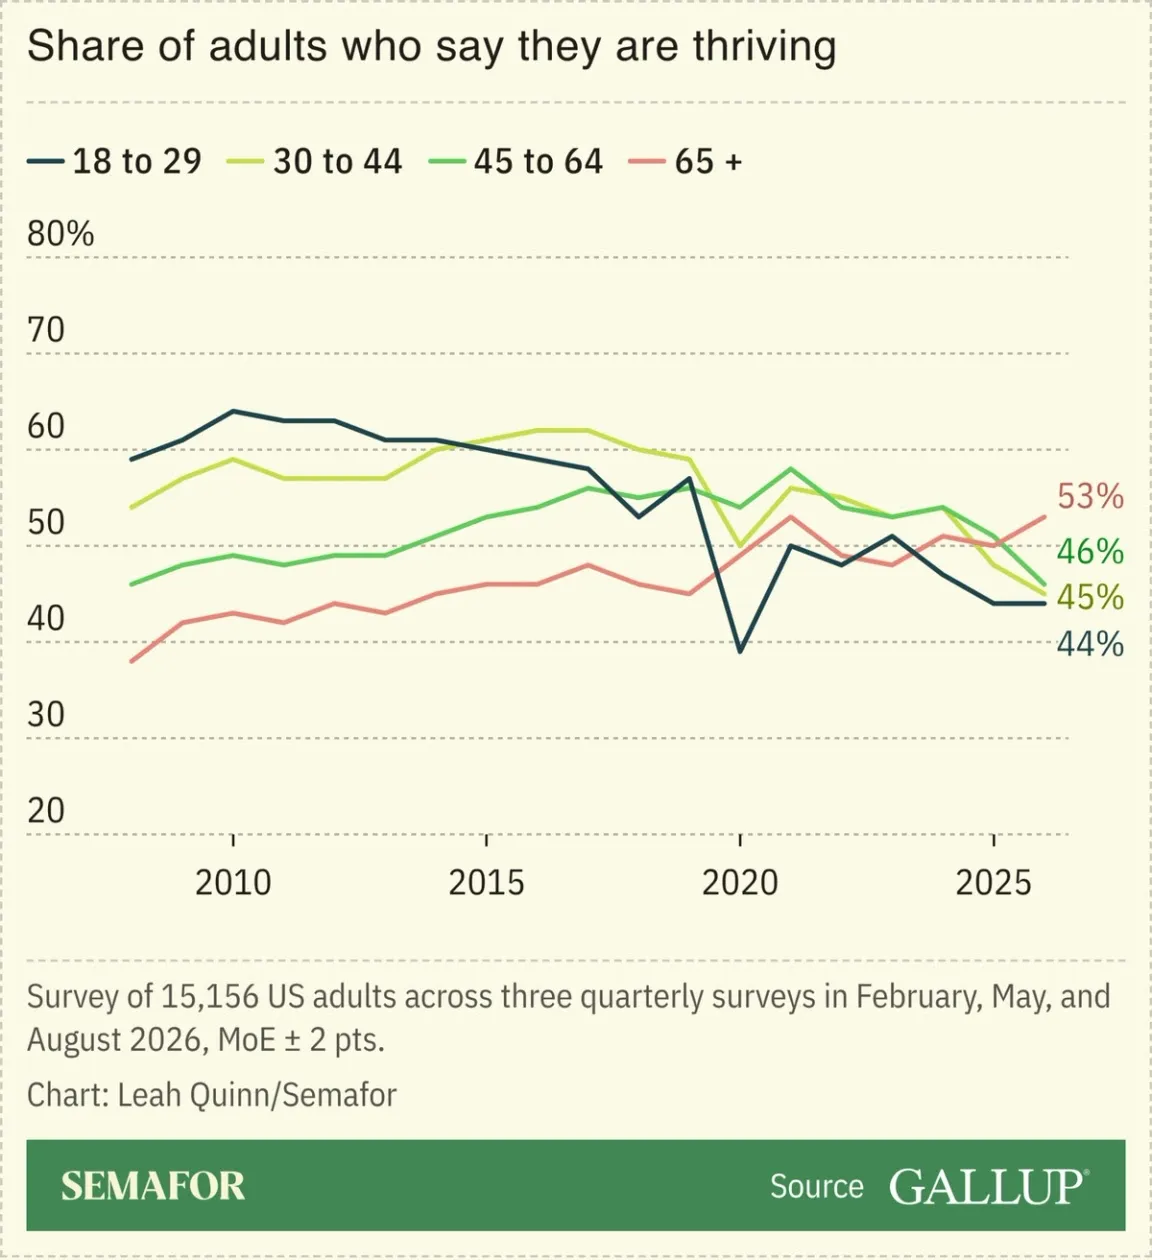
Over the past 20 years, the share of adults who believe they are "thriving" has fallen. In fact, across all age groups, a sense of thriving now correlates with age. The opposite of where it was 20 years ago. This, I believe, explains everything about the current political climate.
Every so often I see a piece of data I want to share immediately.
This arrived in my inbox this morning from Semafor.
I’ve spent time here trying to unpack trends in education, employment and economic pressure this century.
But even if it doesn’t say how we got here, nothing tells a clearer story of where we are right now than this Gallup data.
What strikes me is not that Americans age 18-29 are struggling - that has certainly been covered - but the four age groups tracked here completely inverted in their sense of thriving over the past 20 years.
Boomers are healthier and wealthier than seniors have ever been, benefiting from a long run up in housing and the stock market while living longer, healthier lives.
Young people who had their education thrown into chaos by the pandemic now face a destabilizing job market and the near impossibility of buying a first home.
In the middle, Millennials and Gen X are sandwich generations getting squeezed by rising costs and interest rates and a stagnant labor market that align to make it hard to envision the kind of “move and get a new job” opportunities that were possible just 4-5 years ago.
And across all of this, we have algorithmic social media driving us to compare our lives to the curated versions we see of others.
Note when the 18-29 line peaks and then starts to fall.
So frustration and despair correlate with youth. While the median age in the Senate is 64 and our President is 80. How do we think this is going to play out?